So you realised that for your hobby app free tier of NewRelic is not enough but still you would like to have prolonged history? You don’t want to use anything else. Maybe you have Premium version for your production app but need some monitoring for staging environment? If so continue further. It’s going to be a strictly technical post with a tutorial on setting up metrics collector.
Check new version of this post, featuring Docker
Environment
- Ubuntu 14.04 running on VPS with 2 vCores and 2GB RAM
- Sinatra - Ruby micro framework
- InfluxDB - time series database
- Grafana - graph and dashboard builder for data visualisation
Install Sinatra
Having Ruby installed, installing Sinatra is as simple as:
gem install sinatra
but it might complicate things later so I created directory ‘collector’ and placed new file Gemfile with following content:
source 'https://rubygems.org'

gem 'sinatra'
gem 'sinatra-contrib'

gem 'influxdb' # InfluxDB Ruby Client
and run bundle install in that directory.
Install InfluxDB
To install my database I’ve followed official guide:
# for 64-bit systems
wget https://s3.amazonaws.com/influxdb/influxdb_0.6.5_amd64.deb
sudo dpkg -i influxdb_latest_amd64.deb

# for 32-bit systems
wget https://s3.amazonaws.com/influxdb/influxdb_0.6.5_i386.deb
sudo dpkg -i influxdb_latest_i386.deb
UPDATE: Paul Dix, CEO of InfluxDB, mentioned me on Twitter (yay!) to point, that they don’t use latest anymore and instead nightly or one of releases should be used:
#64-bit system install instructions
wget https://s3.amazonaws.com/influxdb/influxdb_0.9.4.2_amd64.deb
sudo dpkg -i influxdb_0.9.4.2_amd64.deb
Install Grafana
Same goes to Grafana installation:
Add following line to /etc/apt/sources.list:
deb https://packagecloud.io/grafana/stable/debian/ wheezy main
and install package:
apt-get update
apt-get install grafana
and start the service:
sudo service grafana-server start
Create collector
In collector directory create file named… collector.rb (Gist):
require 'sinatra'
require 'sinatra/namespace'
require 'sinatra/json'

require 'base64'
require 'json'
require 'zlib'
require 'stringio'

require 'pry'

require 'influxdb'

use Rack::Deflater

namespace '/agent_listener/:api_version' do |api_version|
  namespace '/:license_key' do |license_key|
    get_redirect_host = { return_value: 'localhost' }
    get '/get_redirect_host' do
      json get_redirect_host
    end

    post '/get_redirect_host' do
      json get_redirect_host
    end

    connect =
      { return_value: { browser_key: 'xx', application_id: 1, js_agent_loader: '' } }
    post '/connect' do
      json connect
    end


    metric_data = {}
    post '/metric_data' do
      request.body.rewind
      body = request.body.read
      body = Zlib::Inflate.inflate(body) if request.env["HTTP_CONTENT_ENCODING"] == "deflate"
      metrics = JSON.parse body
      data = []
      metrics[3].each do |meta, values|
        data = {
          tags: { metric_name: meta['name'] },
          values: {
            cnt: values[0],
            val: values[1], own: values[2], min: values[3], max: values[4], sqr: values[5]
          }
        }
        single_to_influx('metric_data', data)
      end
      json metric_data
    end

    analytic_event_data = {}
    post '/analytic_event_data' do
      request.body.rewind
      p request.env
      body = request.body.read
      body = Zlib::Inflate.inflate(body) if request.env["HTTP_CONTENT_ENCODING"] == "deflate"
      json_analytics = JSON.parse body
      data = []
      json_analytics[1].each do |meta, _wtf|
        data << {
          series: 'analytics_data',
          tags: { metric_name: meta['name'], mtype: meta['type'] },
          values: { mduration: meta['duration'] },
        }
      end
      to_influx(data)
      json analytic_event_data
    end

    error_data = { return_value: 'ok' }
    post '/error_data' do
      request.body.rewind
      # p request.body.read
      raw_body = request.body.read
      raw_body = Zlib::Inflate.inflate(raw_body) if request.env["HTTP_CONTENT_ENCODING"] == "deflate"
      json_error = JSON.parse raw_body
      data = []

      json_error[1].each do |err|
        data = {
          tags: { error_method: err[1], request_uri: err[4]['request_uri'] },
          values: { message: err[2] },
          # timestamp: err[0],
        }
        single_to_influx('errors_data', data)
      end
      json error_data
    end

    get_agent_commands = { return_value: [] }
    post '/get_agent_commands' do
      json get_agent_commands
    end
  end
end

def unblob(blob)
  return unless blob
  JSON.load(Zlib::Inflate.inflate(Base64.decode64(blob)))
end

def inflate(string)

end

def to_influx(data)
  begin
    influxdb.write_points(data)
  rescue StandardError => e
    p "----------"
    p data
    p "----------"
    raise e
  end
end

def single_to_influx(name, data)
  begin
    influxdb.write_point(name, data)
  rescue StandardError => e
    p "----------"
    p data
    p "----------"
    raise e
  end
end

def influxdb
  @influxdb ||= InfluxDB::Client.new 'collector', host: 'localhost'
end
As you can see this file parses newrelic/rpm gem messages and events, and saves them to InfluxDB.
Run collector
To run the collector use following command:
bundle exec ruby collector.rb
Your collector is now listening on default Sinatra port (4567).
Change your Rails app configuration
In your existing Rails application find rpm configuration file newrelic.yml and add following values:
development:
  ...
  monitor_mode: true
  host: localhost
  port: 4567
  api_host: localhost
  api_port: 4567
  ...
Connect Grafana to InfluxDB
Navigate to your Grafana instance (http://localhost:3000 by default) and login with default admininstrator account (login: admin@localhost pw: admin).
Add Dashboard
From sidebar select ‘Data Sources’ and click ‘Add new’.
Give it some name, from Type dropdown select ‘InfluxDB’ and set URL of your Datasource to http://localhost:8086. Your database name is ‘collector’ and default login credentials are again admin with password admin.
Hit Save and from top menu select ‘+ New’ to create new dashboard.
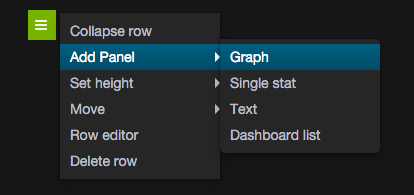
Add Graph to Dashboard
To add panel to Dashboard, locate tiny green rectangle and click it - it will open the Row menu where you can add Graph Panel.
Click on graph and select ‘Edit’ from menu that will appear. On Metrics tab set ‘Source’ to created data source and write query as:
SELECT max(mduration) FROM "analytics_data" WHERE "mtype" = 'Transaction' AND $timeFilter GROUP BY time($interval), "metric_name"
Set ‘Group by time interval’ to > 60s.
Play with other tabs or fill Axis and Grids with following values:
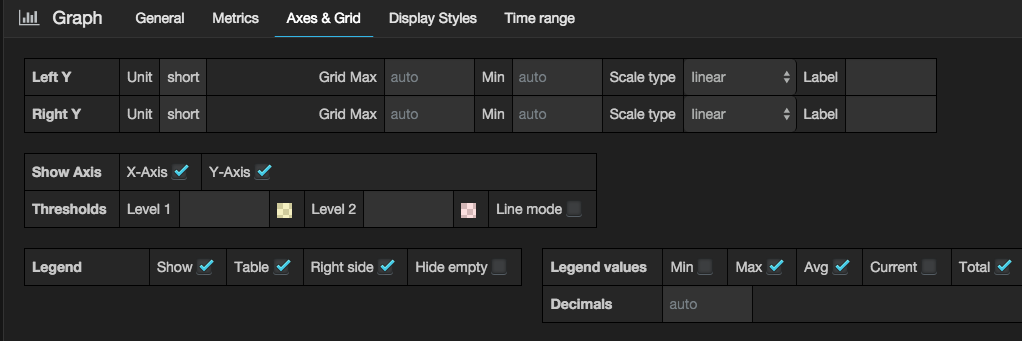 and Display Styles like this:
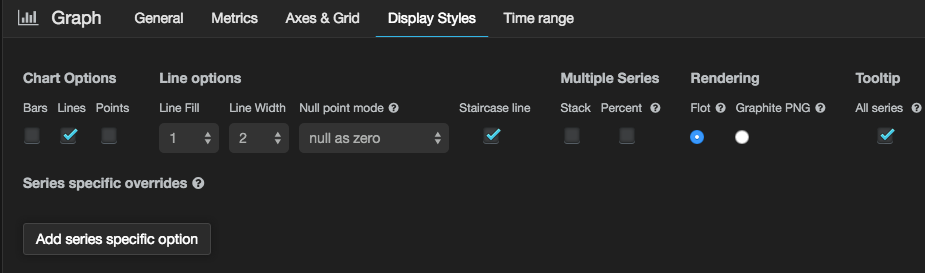
Remember to click ‘Save dashboard’ icon on top menu.
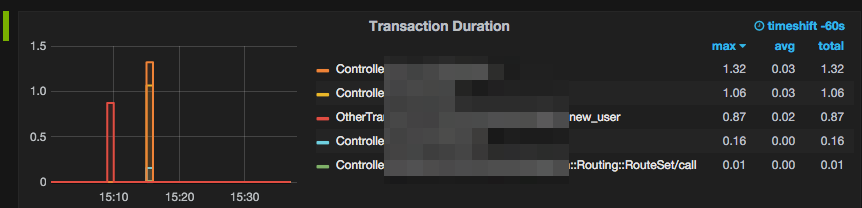
Enjoy analysing your metrics
If everything is configured properly after a while your dashboard should be filled with colorful metrics:
More metrics
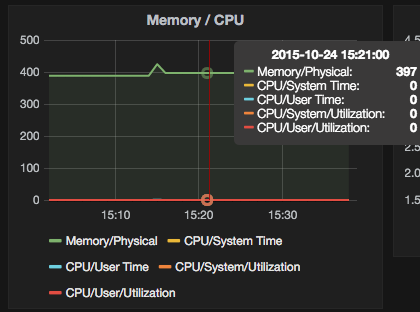
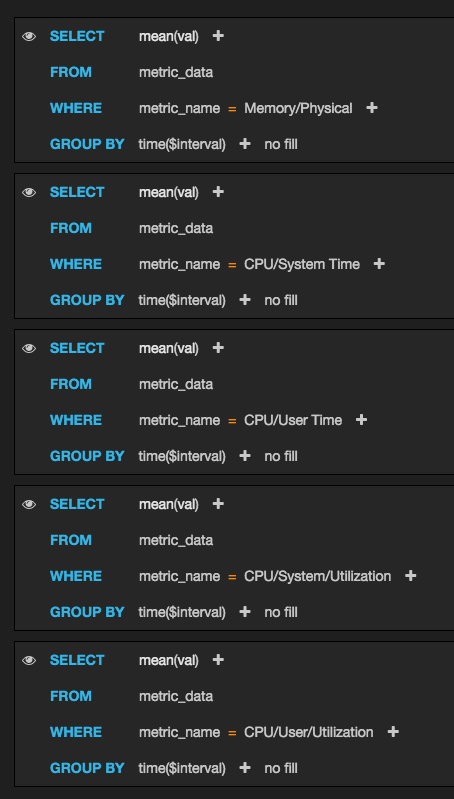
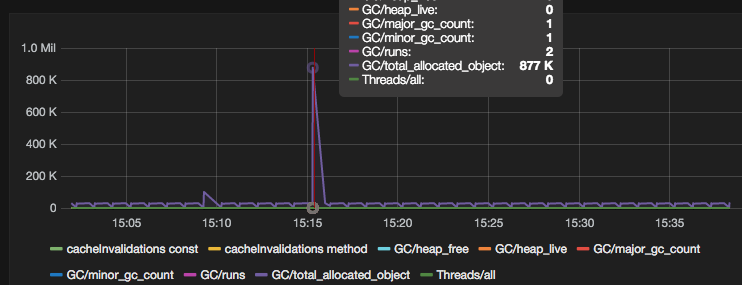
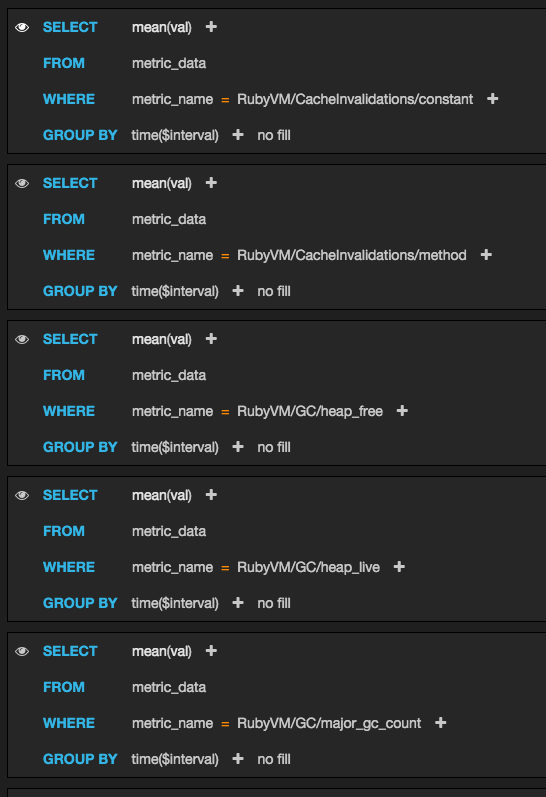
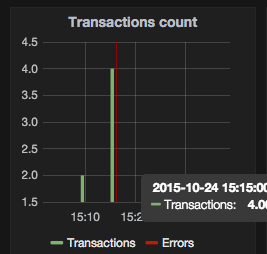
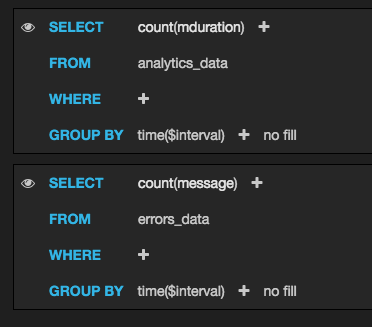
There are more metrics collected presented, so you can add more panels and graphs to present CPU/memory usage, Ruby Garbage Collector metrics and Transactions to Errors statistics. These examples are created using the Query Builder:
- CPU/Memory
- Garbage Collector
- Transactions count
Known issues
- timestamp is saved as metrics receive time, not the real timestamp coming from metrics payload
- InfluxDB database should be configured with some data retention options (now data is stored forever)
Ideas for further development
- create a proxy server for rpm gem out of this tiny app that will allow to simultaneously store metrics in InfluxDB and push them to NewRelic.
Please note that I’m not connected with NewRelic in any manner and this code is more like proof-of-concept and is not intended for usage on production environment.